Software developerLuxembourg / Völklingen

Laurent
Brand.

I build data tools.
I run my own infrastructure.

For my bachelor’s thesis, I turned 11 traffic feeds into a dashboard for 2.8 million measurements. At home, I run a two-node homelab and build tools to manage it.

Work

What I’ve built.
How it works.

From Luxembourg’s roads
to my own servers.

Bachelor’s thesis
2026 · Data engineering

Prototypisches Dashboard Luxemburger Verkehrsdaten

How I turned Luxembourg’s live traffic feeds into a history I could explore.

  • Python
  • PostgreSQL 17
  • Streamlit
  • Polars
  • Docker Compose
11feeds ingested
2.8Mmeasurements collected
15 GBevaluation database

23 Jul–3 Sep 2026
Archived evaluation dataset

Inside the engineering

From a live feed
to a useful answer.

The CITA feeds showed current road conditions. I wanted a history I could query: what changes across hours, roads, and days? I built the collector and dashboard to find out.

Open a stage to inspect the decision.

Collect · PythonArchive before parsing.Live responses → preserved source

My collector runs as its own process. It saves each new response before parsing and uses SHA-256 hashes to detect duplicates.

The boundary

The archive preserves what arrived. An interruption still leaves a gap in what I can analyse.

Read about the 18-hour gap
Store · PostgreSQL 17Give the data its own history.Parsed responses → normalized measurements

I write normalized records to PostgreSQL. The dashboard reads this stored history independently of the live feeds.

What this enables

I can compare roads, hours, and days without asking the source for those observations again.

2.8M measurements · 23 Jul–3 Sep 2026

Explore · Streamlit + PolarsMake the pattern inspectable.Stored history → hourly comparison

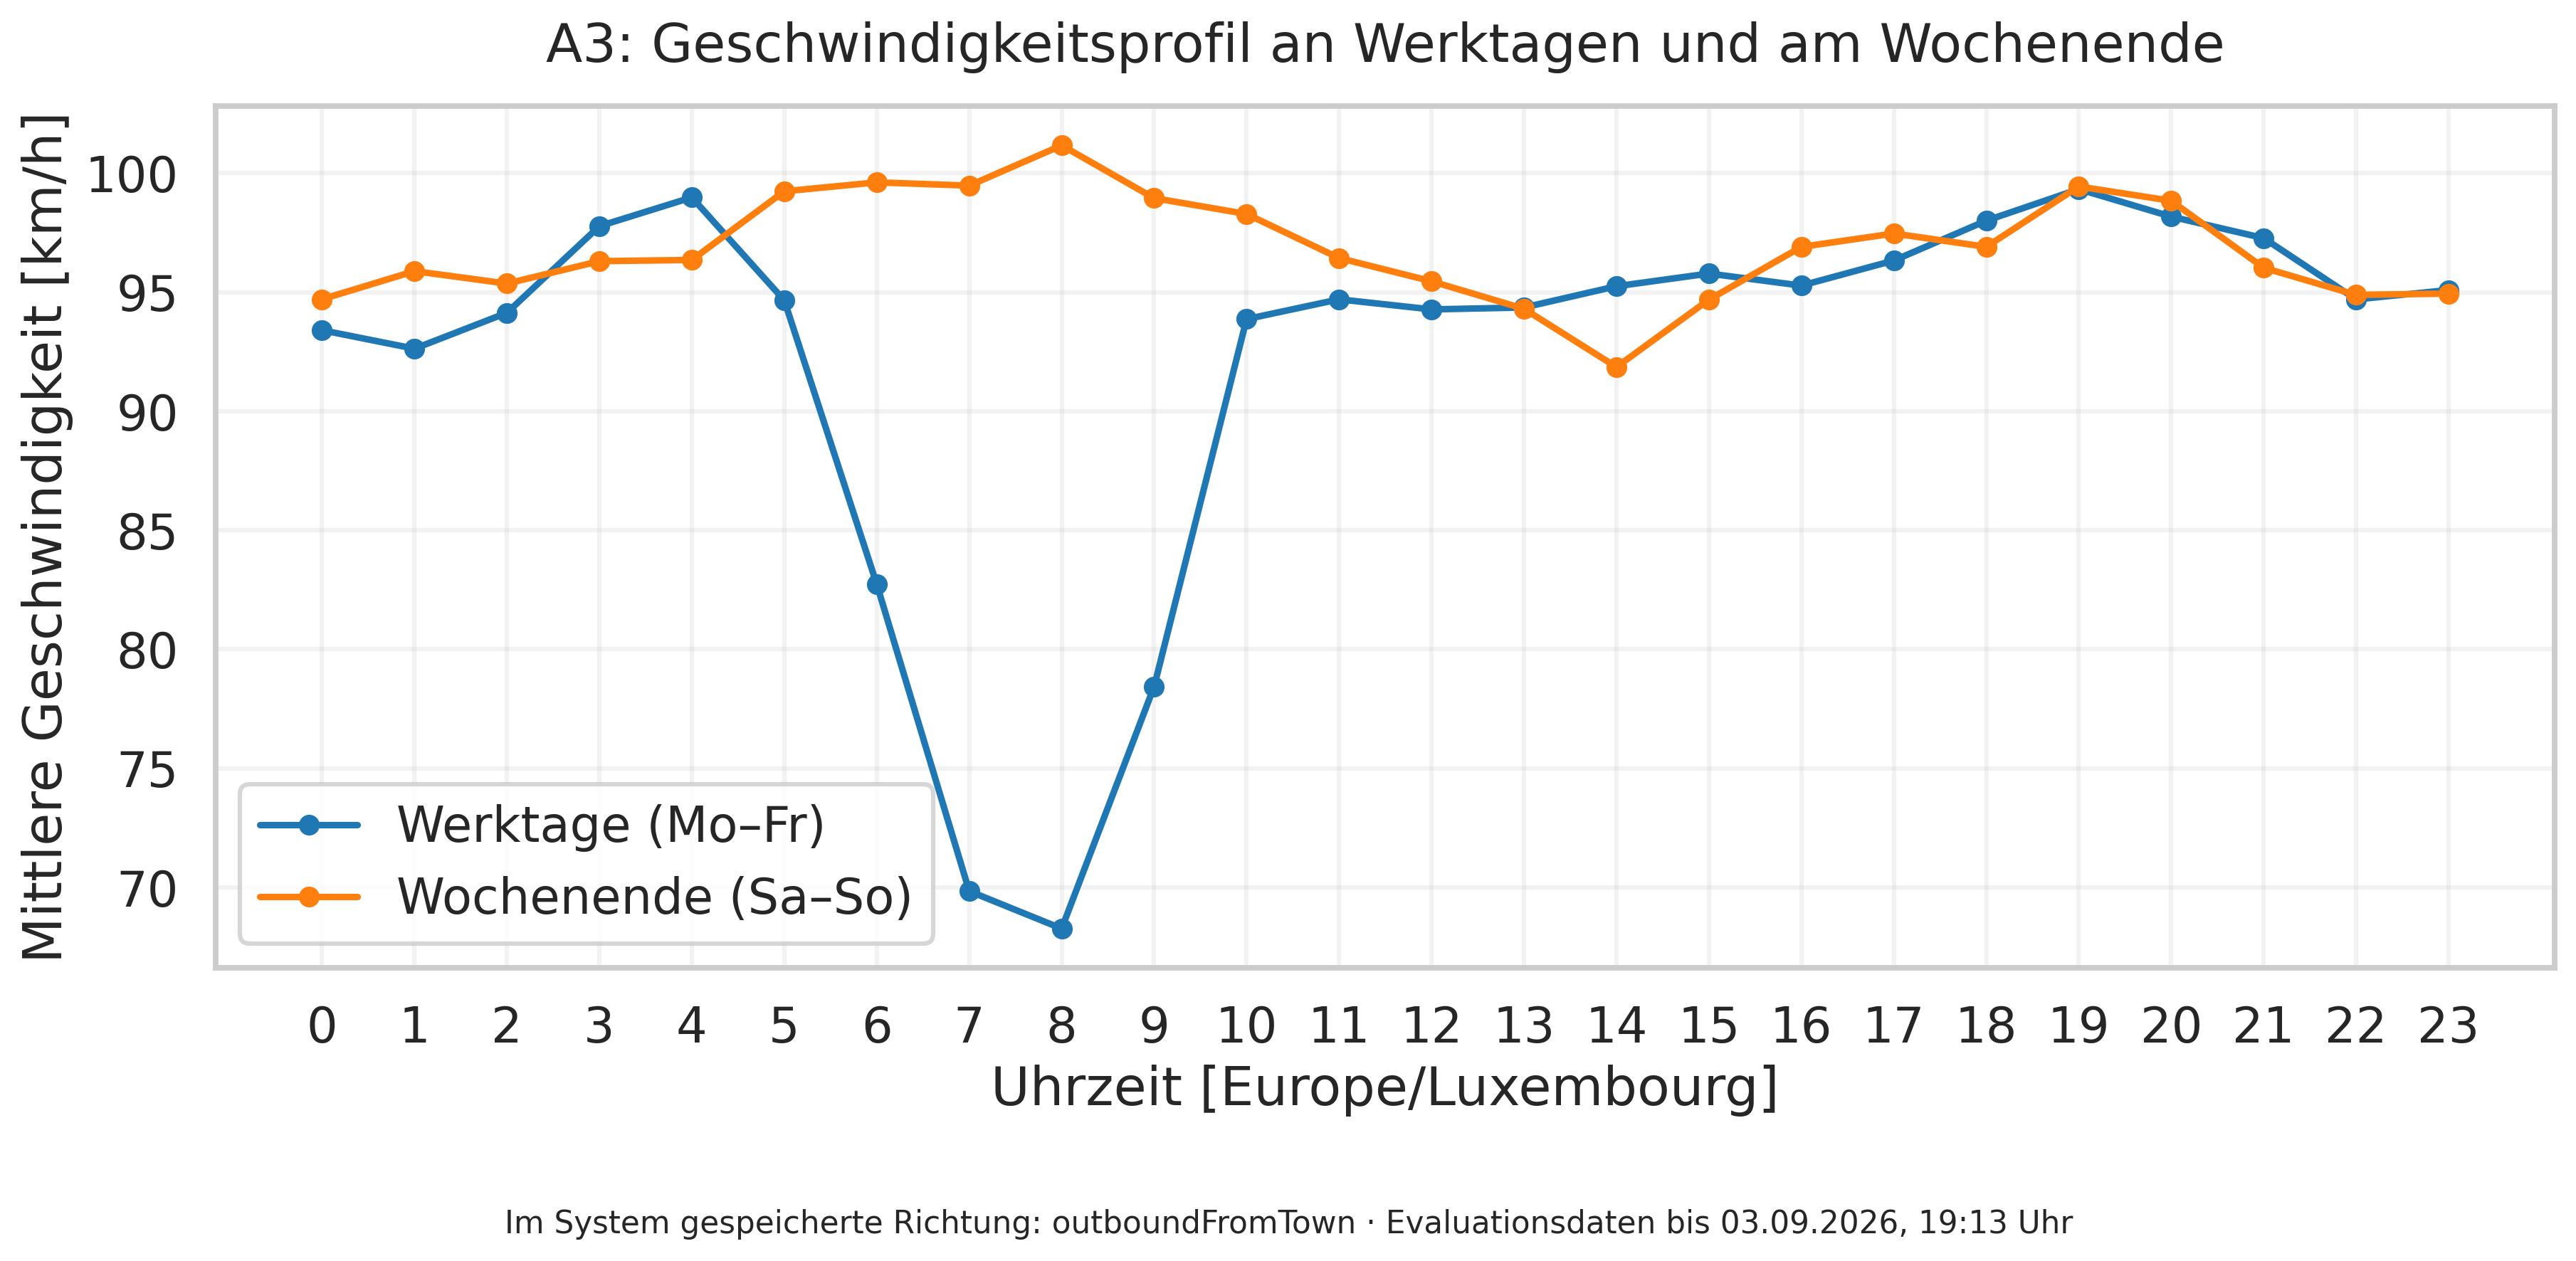
Polars prepares the analysis; my Streamlit dashboard queries the history. One finding was a weekday morning speed dip on the A3.

Inspect the evidence

The figure below exposes the hourly means, observation counts, source window, and method.

Explore the A3 comparison
How I built this dataset

From my bachelor’s thesis

The A3, hour by hour.

In my sample, weekday speeds dipped in the morning; the weekend profile stayed steadier.

Weekday vs. weekend mean speeds · A3 · stored direction outboundFromTown

Historical observations

Explore the day Hover or drag to inspect an hour. Keyboard: ← / →, Home / End; Escape resets to 08:00.

Weekday versus weekend mean speed on Luxembourg’s A3 Observation-weighted hourly means, 23 July–3 September 2026, stored direction outboundFromTown. No geographic direction is inferred. Missing hourly values remain gaps. Selected hour: 08:00 · Weekdays: 68.3 km/h · Weekend: 101.2 km/h. km/h 0306090120 08:00 Weekdays Weekend 00040812162023 Hour · Europe/Luxembourg
08:00 · Weekdays: 68.3 km/h · Weekend: 101.2 km/h
Collected 23 July–3 September 2026 · Europe/Luxembourg. Observation-weighted hourly means: Monday–Friday versus Saturday–Sunday. Source: thesis section 6.4.1 / figure 6.4 and its hourly export. All hourly groups have observations; collection gaps remain in the source. Missing hourly values stay as breaks. The stored direction label is not independently verified geographically.

I built the collector and dashboard so I could turn live traffic feeds into a history of patterns I could compare across hours and days.

Read the data and method

Source: my bachelor’s thesis, section 6.4.1 / figure 6.4, and its evaluation_hourly_profile.csv export. I grouped Monday–Friday and Saturday–Sunday and weighted each weekday/hour mean by its observation count, following the thesis plotting code. Source rows include positive speed, flow, and occupancy values; results are rounded to 0.1 km/h. The source window runs from 23 July 2026, 16:23 to 3 September 2026, 19:13 (Europe/Luxembourg).

View the 48-point aggregate JSON ↗ View the original thesis figure ↗
Scroll within the table to see all hours and columns. Speeds are in km/h; observation columns show sample counts.

A3 hourly profile · stored direction outboundFromTown
HourWeekday km/hObservationsWeekend km/hObservations
00:0093.44,35794.71,731
01:0092.64,23695.91,730
02:0094.14,21795.41,651
03:0097.84,33496.31,644
04:0099.04,40496.41,632
05:0094.74,50399.21,641
06:0082.74,50299.61,645
07:0069.84,58099.51,675
08:0068.34,600101.21,706
09:0078.44,55999.01,645
10:0093.94,54098.31,682
11:0094.74,53196.41,699
12:0094.34,61195.51,726
13:0094.44,54394.31,693
14:0095.34,57891.91,671
15:0095.84,58194.71,685
16:0095.34,61496.91,669
17:0096.34,68097.51,702
18:0098.04,68596.91,662
19:0099.34,50099.41,659
20:0098.24,46098.81,732
21:0097.34,44196.01,751
22:0094.74,36494.91,749
23:0095.14,40594.91,697
What I learned

On 25 July, a TLS negotiation failure left an 18-hour gap. I fixed collection, but couldn’t recover the missing measurements from the source. I learned to make gaps visible alongside the charts, rather than let a neat line imply the data was complete.

Featured project · My homelab

The systems I run at home.

I run two Proxmox nodes for the services I use every day: media, documents, home automation, and monitoring.

On my primary node, a Debian VM hosts Docker services, alongside a separate Tailscale LXC and Windows 11 VM. On the second, Home Assistant OS has its own VM; another Debian VM runs Pi-hole and Uptime Kuma in Docker.

  • Proxmox
  • Debian
  • Docker
  • Networking
  • Monitoring

What I run

Media
Plex · Jellyfin · Tautulli
Documents
Paperless-ngx · scanservjs
Home & network
Home Assistant OS · Pi-hole · Tailscale
Monitoring & management
Uptime Kuma · InfluxDB · Portainer · Homarr
Proxmox node

Primary node

VM
Debian
DockerMy application services
  • Plex
  • Jellyfin
  • Tautulli
  • Paperless-ngx
  • scanservjs
  • InfluxDB
  • Portainer
  • Homarr
LXC
Tailscale

Remote access

VM
Windows 11
Proxmox node

Second node

VM
Home Assistant OS

Home automation

VM
Debian
DockerSeparate containers
Container
Pi-hole

Local DNS & network-wide ad blocking

Container
Uptime Kuma

Monitors the primary node & its services

My current, running setup. Node boundaries contain the VMs and LXC; Docker services sit inside their Debian VM. Uptime Kuma monitors the primary node and its services.

My own software

Homelab Command Center

I built one place to find my services and check whether they respond. I can search by name, filter by category, edit the catalog, and see HTTP availability and response times.

React handles the interface; a Node.js / Express API stores the catalog in JSON. An optional read-only Proxmox integration adds node, guest, and storage views.

  • React
  • Node.js
  • Express
  • Docker

What I built

  • A searchable service catalog with category filters
  • HTTP reachability checks and response times
  • An optional Proxmox infrastructure view

Experience

Where I work.
What I studied.

A little about me

I’m from Luxembourg and based in Völklingen. I write Python, work with PostgreSQL, and run my own Linux servers. For my bachelor’s thesis, I took a set of live traffic feeds all the way from collection to a dashboard I could use to explore their history.

I study Computer Science at Hochschule Trier, where I started in 2022. I submitted my thesis on 15 September 2026 and defended it on 2 October 2026.

Away from the keyboard

I also build custom watches. When I step away from servers and code, I like putting something together that I can wear.

@brnd.lu

Work experience

Nov 2026–Present

SaJo

Working Student in Software Development

I work as a student in software development.

Apr 2025–Present Planned last day: 31 March 2027.

ZF Group

Working Student

I work alongside my studies in an industrial environment at ZF Group.

Education

Started 2022

Hochschule Trier

B.Sc. Computer Science

Thesis submitted on 15 September 2026; defended on 2 October 2026.

Software

Python · Java · JavaScript · SQL · Git · Automated tests

Data

PostgreSQL · Polars · Streamlit · XML / DATEX II

Infrastructure

Proxmox · Debian · Docker Compose · Linux · Monitoring

CV

The details, on one page.

My experience, education, and selected work in a clean, printable format.

View my CV

Contact

Have something
I can help build?